NZ covid current status
Last updated: Friday 17 October 2025 01:52PM
If you want to talk to me about this I am thoughtfulnz on mastodon.nz and bluesky.app
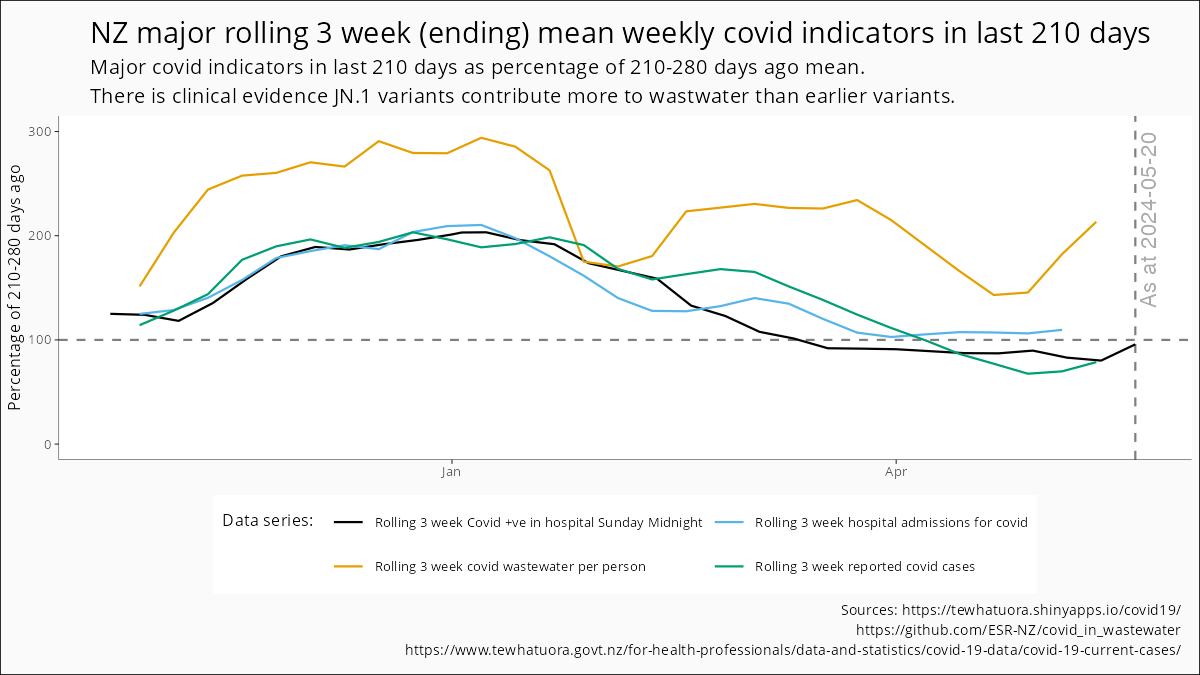
Recent National indicators
Useful indicators in the last 6 months compared to the average for that indicator for the year of 2024 (last full year, and we are more than 180 days into 2025, so an off-graph baseline.
Recent Regional indicators
Some regions have data available for both wastewater for a major centre within the region, and the people in hospital with covid information for the DHB area. Those in more rural locations should normally assume that waves lag a bit from the big centre as they spread out from the near larger centre trying to follow less frequent pathways of casual exposure. The clear exception being non-casual exposure times like January in Tairāwhiti.
The point of comparison of these is the average 2024 calendar year level, as at time of setting this up we were well into 2025.
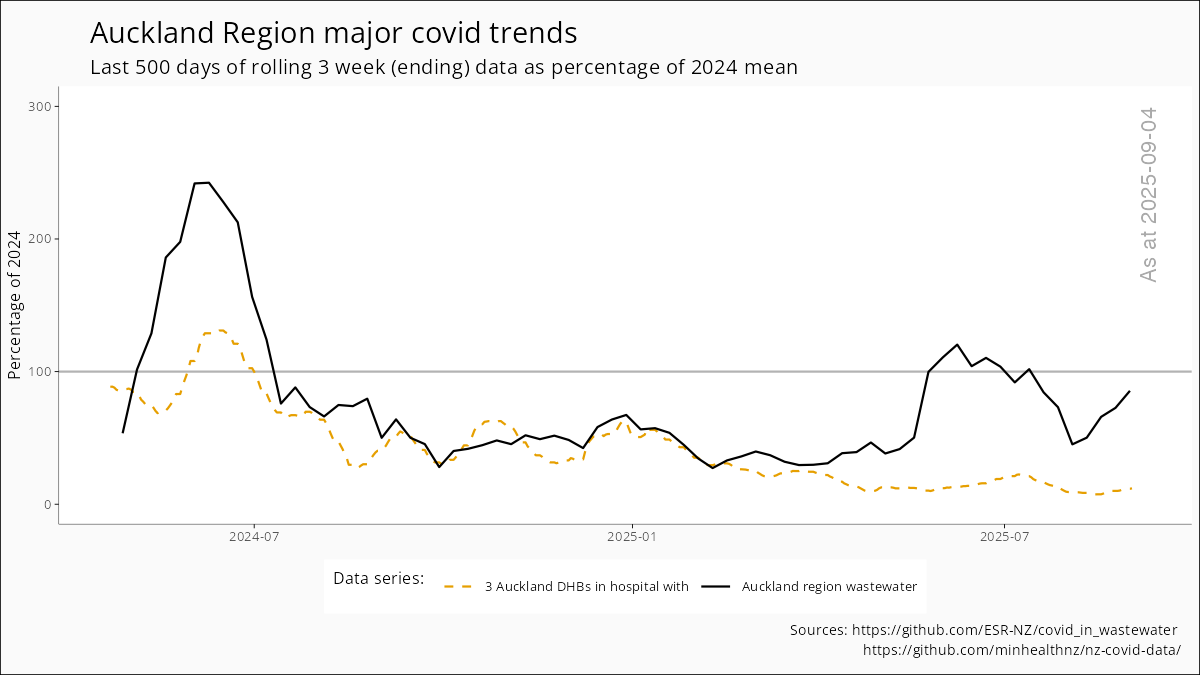
Greater Auckland
Because Auckland the area and operation of the Auckland DHBs is so linked together, I thought best to use the Greater Auckland wastewater and combine the three DHBs together, on the understanding that covid can be making its way around internally for a while in waves rather than more of a one and done you might see in smaller locations.
Lakes (Rotorua)
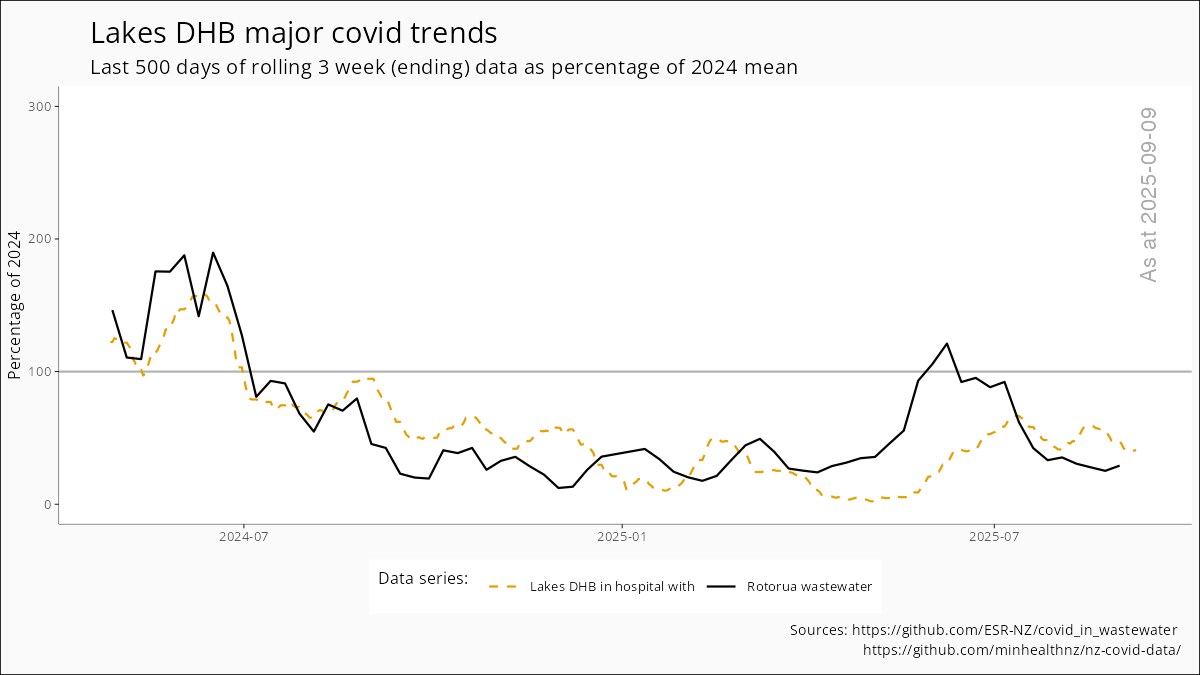
The Lakes DHB is headquartered at Rotorua, and Rotorua has a still current wastewater series
Wellington Region
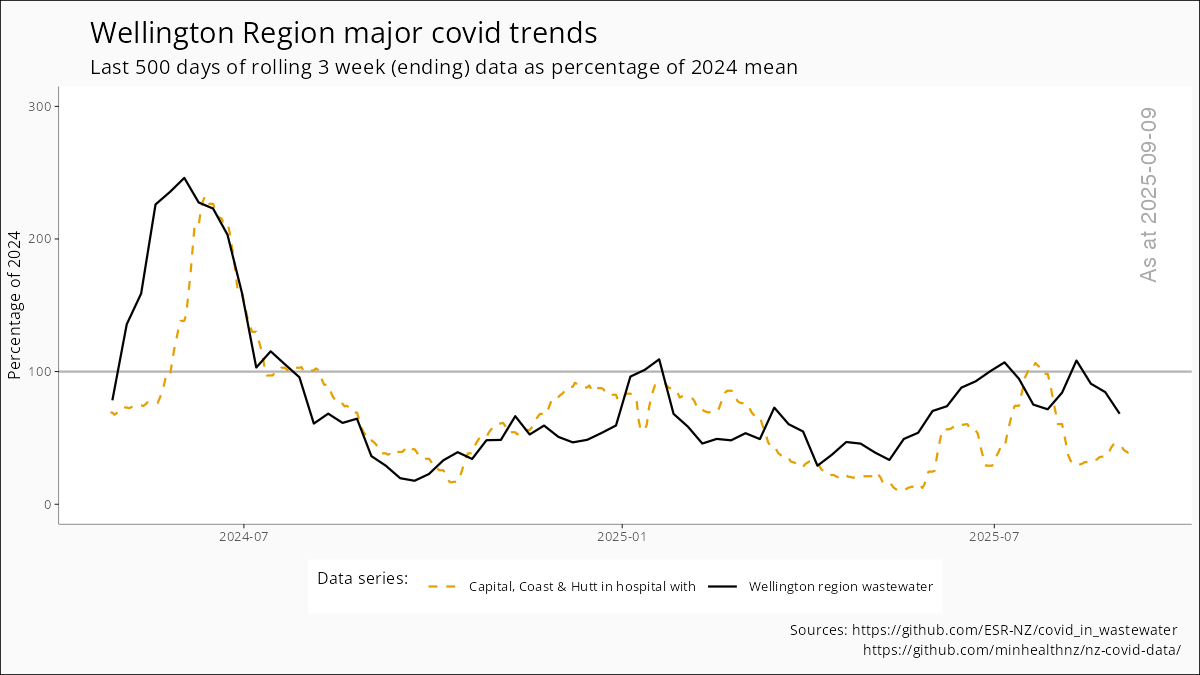
I thought the best match for the wasterwater sites was the combined Capital/Coast and Hutt DHBs.
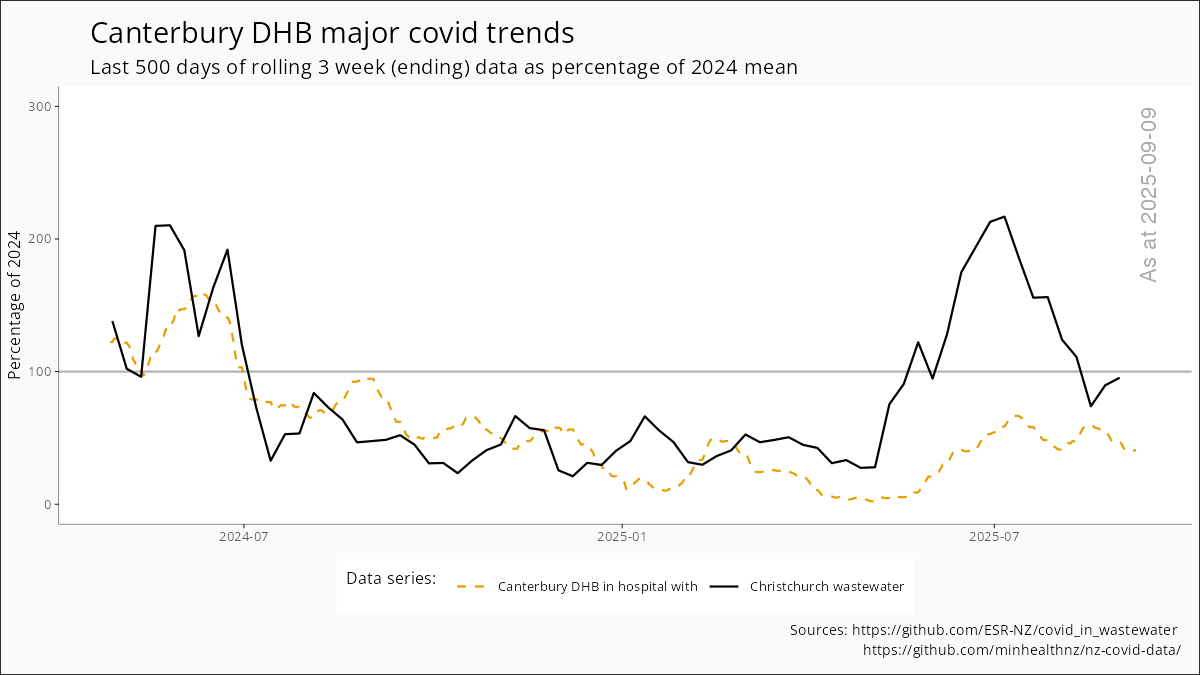
Canterbury (Christchurch)
This matches Christchurch wastewater sampling with Canterbury DHB in hospital with covid, but then Christchurch is 60% of the population of Canterbury.
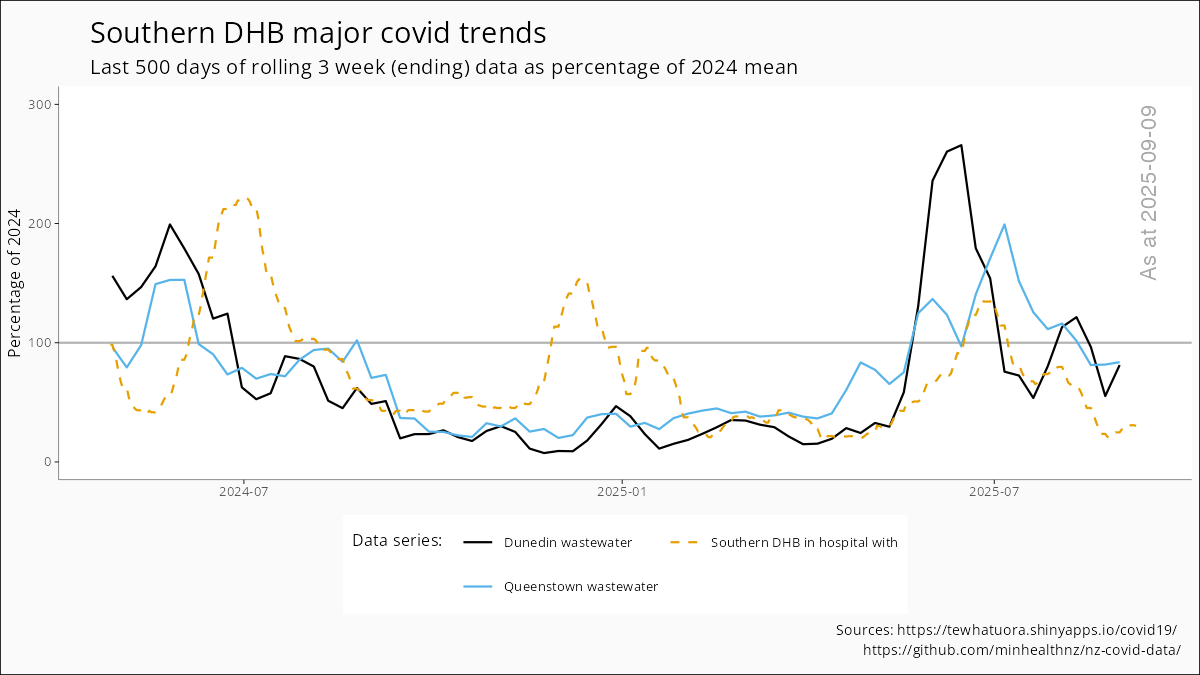
Southern (Dunedin and Queenstown)
Since both Dunedin and Queenstown wastewater was available, I decided to list them both. Keep in mind Queenstown is much more younger tourist visitors than Dunedin (and the Queenstown tourism population can fluctuate a lot from month to month).
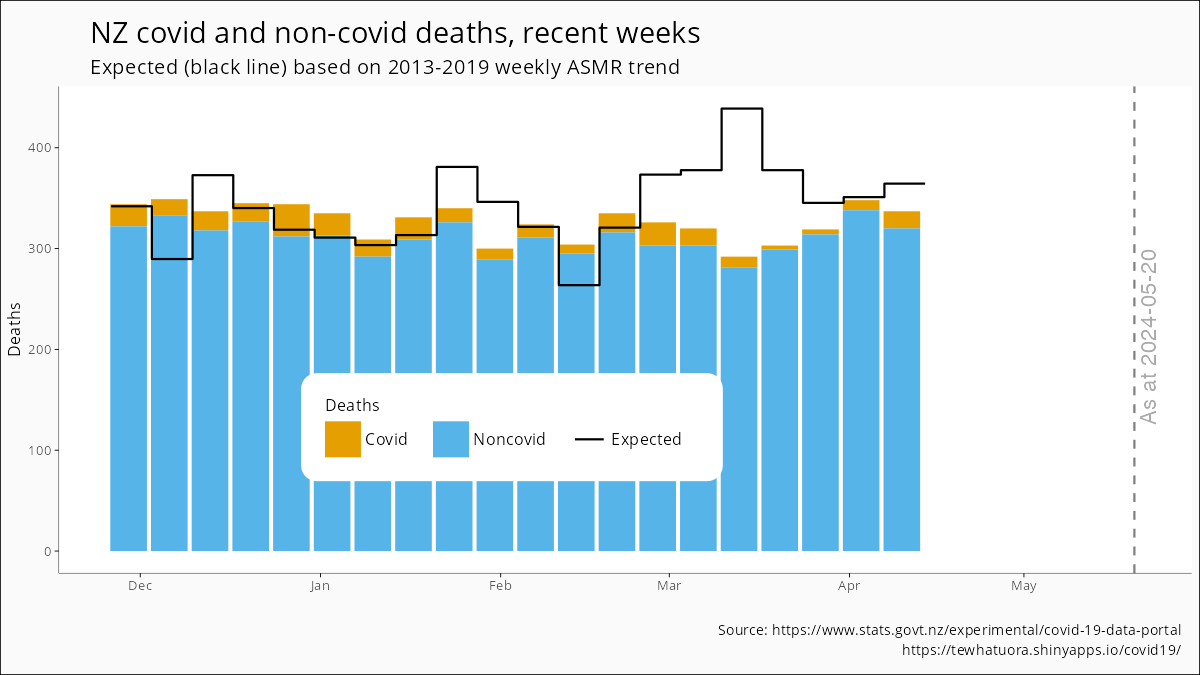
Death recent Trends
Covid and non-Covid weekly deaths compared to the ASMR based expected total deaths for that week, based on the 2014-2019 +2023 trend for that week of the year. This is a recent change from the 2013-2019 baseline. As 2023 was closer to that baseline than many of the years in 2013-2019 it seems entirely reasonable medium-term just to skip 2020-2022 as acute pandemic outliers, and begin moving the baseline forwards (as was the custom pre-covid). Then reassess it all in 2029 when there is a grand arc of history to look at.
As an outcome measure (and lagging) this is different to the key indicators.
Sources
This report currently depends on
- Current cases webpage: https://www.tewhatuora.govt.nz/for-health-professionals/data-and-statistics/covid-19-data/covid-19-current-cases/
- Ministry of Health covid data archive: https://github.com/minhealthnz/nz-covid-data/
- Shiny covid app: https://www.tewhatuora.govt.nz/for-health-professionals/data-and-statistics/covid-19-data/covid-19-current-cases/
- Wastewater: https://github.com/ESR-NZ/covid_in_wastewater this is available in a friendly public session at https://poops.nz